The model for H2 valley demands#
PyPSA-Spain includes a functionality to model geolocalised annual hydrogen demands associated with so-called H2 valleys (clusters of industrial, mobility or sectoral H2 consumers planned at a given location). Each H2 valley represents a fixed annual amount of hydrogen consumed inside the Spanish system at a given geographical location, which the model then distributes as a constant load over the whole year.
The required elements are added during the rule prepare_sector_network, after the regular sector-coupled network has been built. The configuration relies on two groups of elements: a YAML file describing the H2 valleys, and a corresponding entry in the pypsa_spain module of the configuration file.
The repository ships with several template YAML files that can be used out of the box or as a starting point for custom scenarios:
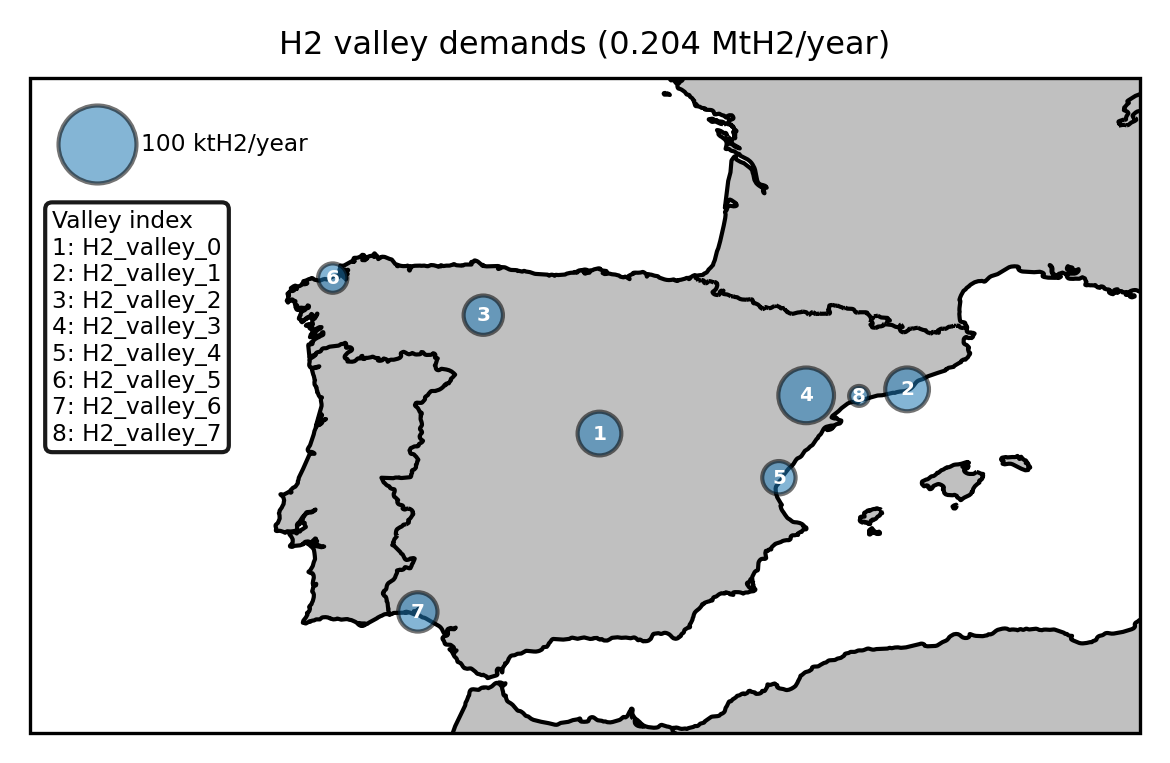
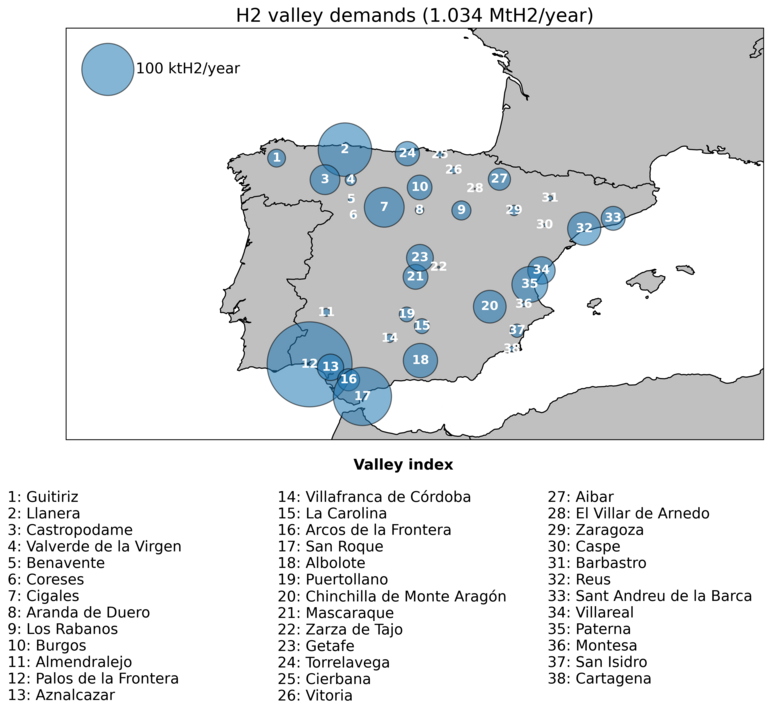
data_ES/H2/H2_valley_demands.yaml— built from the IDAE resolution (July 2024) that awarded the first call of the Spanish incentive programme for renewable hydrogen production and consumption projects (clusters or valleys). For details, see PR #18.data_ES/H2/H2_valley_demands_CfI_2030.yamlanddata_ES/H2/H2_valley_demands_CfI_2040.yaml— built from the results of the Call for Interest process launched by Enagás in September 2023 (results presented in January 2024), providing H2 demand projections for 2030 and 2040 respectively. For details, see PR #21.
The figures below show the H2 valleys defined in the IDAE template (left) and in the Enagás Call for Interest template for 2030 (right):
|
|
Model components#
For each H2 valley, a fixed H2 load is attached to the closest H2 bus of the Spanish network. The closest H2 bus is identified at runtime based on Euclidean distance between the H2 valley coordinates and the H2 buses in peninsular Spain. The annual hydrogen mass is converted to a constant H2 power setpoint via a pure unit change (mass → energy through the H2 lower heating value):
where \(33.33 \times 10^6\) MWh is the lower heating value of one million tonnes of H2, and \(\sum_t w_t\) is the total weight of the snapshots (equal to 8760 hours for full-year runs at any temporal resolution). The constant H2 load is imposed by directly setting loads_t.p_set for the load.
Configuration#
The functionality is enabled in the pypsa_spain module of config/config_ES.yaml:
H2_valley_demands:
  enable: true
  file: data_ES/H2/H2_valley_demands.yaml
The characteristics of each H2 valley are defined in the file referenced above. Each entry specifies the valley coordinates (x, y) and the annual hydrogen demand in MtH2/year. The bus field of the load is left empty in the YAML file and assigned at runtime to the closest H2 bus on the Spanish network.
Note
Because the load is placed on the H2 bus (not on the electrical bus), the electricity needed to produce that hydrogen is computed endogenously by the optimiser via the electrolysers. To avoid double counting, any share of electricity demand that was originally intended for H2 production must be removed from the regular electricity demand input.
Modelling assumptions and limitations#
The current implementation deliberately makes some simplifications:
The H2 demand of each valley is imposed as a constant load over all snapshots. Intra-annual variability of the demand is not represented.
Each valley is attached to a single H2 bus, identified as the closest one by Euclidean distance. The internal hydrogen distribution network within the valley is not modelled.
The annual amount is treated as exogenous: it is not co-optimised with the rest of the system.